CS 7491 Spring 2004 Project 1
Nguyen Truong & Howard Zhou


Source: CurveCompression.zip
Project Description
Project Objective: To experiment on the compression and decompression of polygonal curves and using hausdorff distance to measure similarities between curves.
List of Modules
| Modules | Explanation |
|---|---|
| Normalization | Express curve vertex coordinates in the range of zero to one. |
| Quantization | Convert real coordinates in the range of zero to one to integer coordinates in the range of 0 to 2^b, where b is the number of bits given by the user (default 10) |
| Prediction | Given vertices v(i), v(i+1), v(i+2), this function computes the integer coordinates for v(i+3) using the quadratic predictor: v(i+3) = v(i) + 3[v(i+2) - v(i+1)]. It then computes the residuals: the difference vector between the prediction and the actual coordinates. |
| Statistics | Display compression statistics |
| Compression | Compute the Huffman tree and codes for the residuals. Encode the codebook using binary tree. Encode the residuals. |
| Decompression | Read the compressed file and reconstruct the Huffman tree. Decode the residuals and use them with the information contained in the header to computer the actual quantized curve. |
| Dequantization | Converts the integer coordinates back to its real coordinates from zero to one |
| Denormalization | Convert the coordinates in the range from zero to one to original curve coordinates (with the min-max box obtained from the header) |
| Subdivision | Subdivide the current curve using either B-spline, 4-point, or Jarek's subdivision method |
| Simplification | Simplify the curve by using B-bit quantization and removing all vertices that are identical to their previous neighbor. |
| Hausdorff | To compute the Hausdorff distance between two curves. Sample one curve, then compare the distances between vertices on this curve against edges on the other. The switch the curves. |
Link to the source code: Curve doc,
Compression doc
Language:C++
System: Windows, Visual Studio 6.0
Sources of inspiration:
- Bit file access, Adaptive Huffman Codeing http://ourworld.compuserve.com/homepages/marktoml/cppstuff.htm
Description of binary format:
header:
201 0.000000 -0.999965 10.000000 1.000000 10 10 0 0 1024 5 1023 10 1021 396 7 17 |
# of vertices in the curve min X, min Y coordinates max X, max Y coordinates # of bits X, # of bits Y compression scheme (0 for huffman) vertex 0 x, y vertex 1 x, y vertex 2 x, y # of data points to compress # of symbols appeared # of bits used to encode the huffman binary tree |
How's the header encoded?
The header is compressed using the adaptive huffman encoding on normal ASCII
character set
How's the codebook encoded?
The vocabulary of the code book is included in the header and compressed using
the adaptive huffman encoding on ASCII character set. The structure of the
codebook is encoded as a huffman binary tree (traversed in depth first order)
Result
Codec
- Input: A link to the input file in ASCII format, which contains the number of points in the first line and then two coordinates in [0, 1023] per line.
- Compressed: A link to the compressed binary file using 10-bit quantization
- B: corresponding half-diagonal error bound
- N: # of vertices
- L: Average edge length L
- F: Total size F in bits of the compressed file
- H%: proportion in % of the file size used for the header
- E: Entropy E
- Excess: (F-NE)/(NE)
- HD: The Hausdorff error between the original and the simplified curve
- HDB: The Hausdorff error between the original and the curve obtained by B-Spline subdivision of the simplified curve
- HD4: The Hausdorff error between the original and the curve obtained by 4-point subdivision of the simplified curve
- HDJ: The Hausdorff error between the original and the curve obtained by Jarek subdivision of the simplified curve
| picture | input | compressed | B | N | L | log2(L) | F | F/N | H% | E | excess | |
|---|---|---|---|---|---|---|---|---|---|---|---|---|
| 1 | 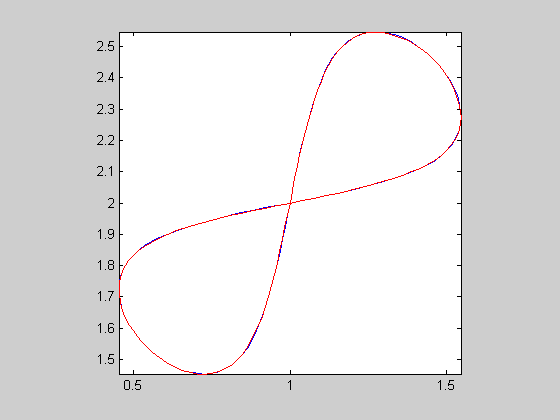 |
c1 | c1c | 0.000753754 | 128 | 0.0267676 | -5.22337 | 1096 | 8.5625 | 42.3358 | 2.2051 | 2.88305 |
| 2 | 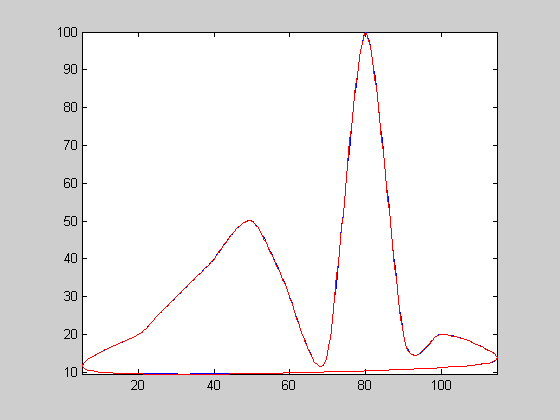 |
c2 | c2c | 0.0693933 | 352 | 1.17983 | 0.238581 | 2152 | 6.11364 | 22.3048 | 2.21755 | 1.75694 |
| 3 | 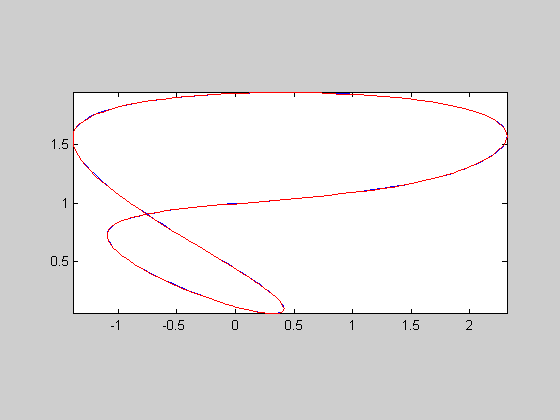 |
c3 | c3c | 0.00202932 | 192 | 0.0604328 | -4.04852 | 1432 | 7.45833 | 34.0782 | 2.23943 | 2.33046 |
| 4 | 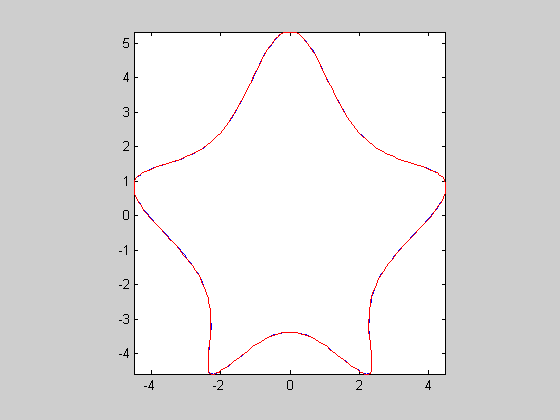 |
c4 | c4c | 0.00654761 | 320 | 0.0969711 | -3.3663 | 2200 | 6.875 | 23.2727 | 2.49895 | 1.75115 |
| 5 | 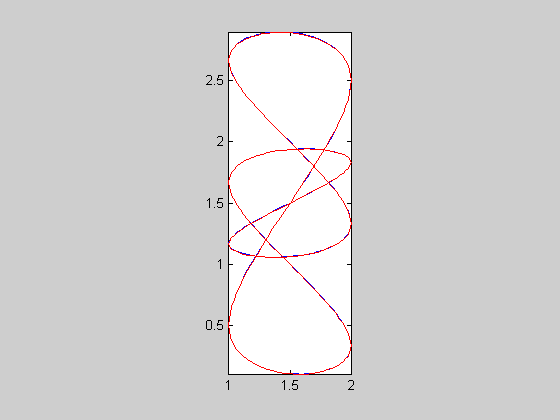 |
c5 | c5c | 0.00145135 | 256 | 0.0459533 | -4.44369 | 1824 | 7.125 | 24.5614 | 2.5419 | 1.80303 |
Simplification and Error
curve 2:
| bits | picture | input | compressed | B | N | L | log2(L) | F | F/N | H% | E | excess | HD | HDB | HD4 | HDJ |
|---|---|---|---|---|---|---|---|---|---|---|---|---|---|---|---|---|
| 5 | 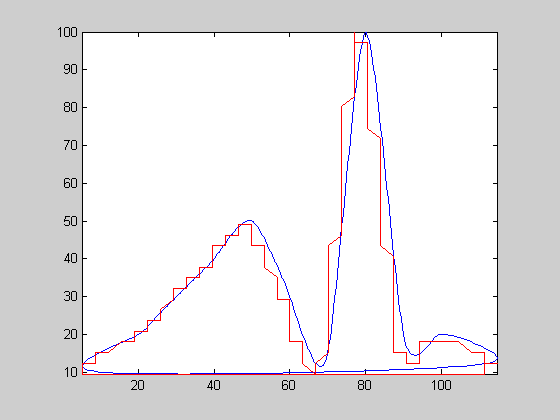 |
c2 | c25sc | 0.0693933 | 147 | 3.21423 | 1.68447 | 1128 | 7.67347 | 42.5532 | 1.9546 | 2.92586 | 3.96537 | 3.33859 | 4.01511 | 3.75644 |
| 6 | 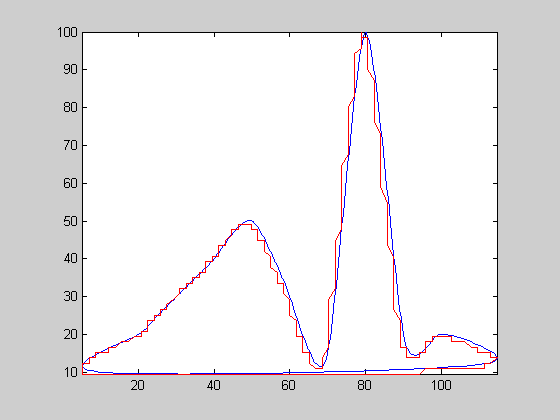 |
c26sc | 0.0693933 | 212 | 2.17404 | 1.12038 | 1552 | 7.32075 | 30.4124 | 2.28518 | 2.20358 | 1.86811 | 1.58166 | 1.89999 | 1.78198 | |
| 7 | 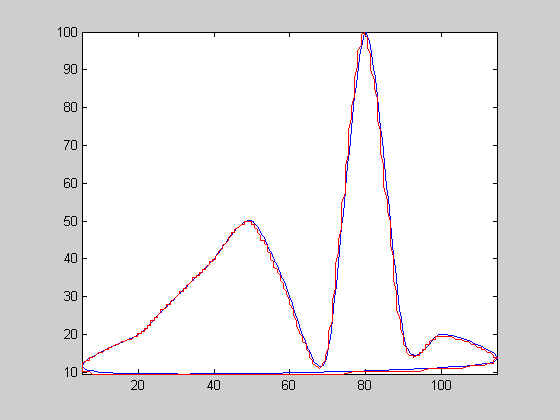 |
c27sc | 0.0693933 | 289 | 1.53073 | 0.614219 | 2008 | 6.9481 | 23.9044 | 2.36244 | 1.94107 | 1.03516 | 0.88165 | 1.04669 | 0.983156 | |
| 8 | 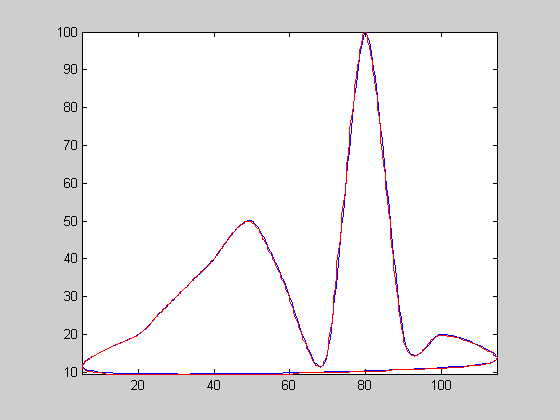 |
c28sc | 0.0693933 | 338 | 1.25048 | 0.322486 | 1976 | 5.84615 | 23.4818 | 2.08257 | 1.80719 | 0.493794 | 0.412394 | 0.493794 | 0.449386 | |
| 9 | 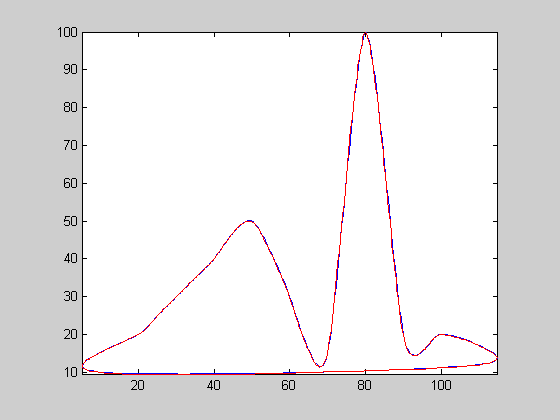 |
c29sc | 0.0693933 | 352 | 1.18568 | 0.245719 | 2288 | 6.5 | 20.6294 | 2.37361 | 1.73844 | 0.258593 | 0.245064 | 0.258593 | 0.252683 |
curve 4:
| bits | picture | input | compressed | B | N | L | log2(L) | F | F/N | H% | E | excess | HD | HDB | HD4 | HDJ |
|---|---|---|---|---|---|---|---|---|---|---|---|---|---|---|---|---|
| 5 | 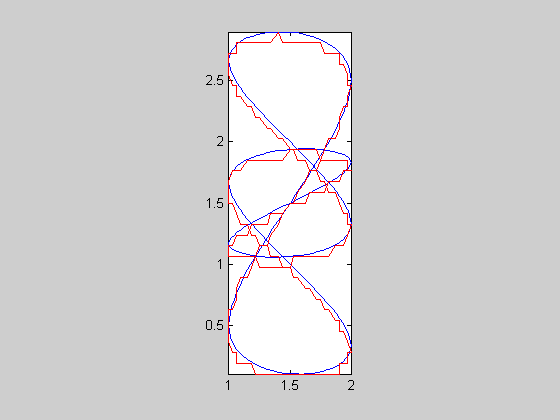 |
c5 | c55sc | 0.00145135 | 222 | 0.0612834 | -4.02836 | 1664 | 7.4955 | 27.8846 | 2.41251 | 2.10692 | 0.0872673 | 0.0851447 | 0.0932807 | 0.0909566 |
| 6 | 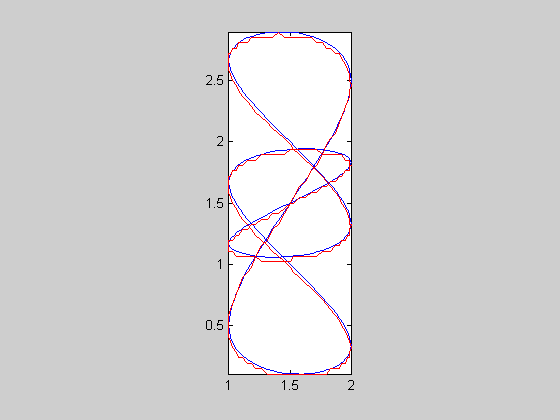 |
c56sc | 0.00145135 | 251 | 0.0493258 | -4.34151 | 1760 | 7.01195 | 26.8182 | 2.31831 | 2.0246 | 0.0433849 | 0.0413729 | 0.0457512 | 0.0445049 | |
| 7 | 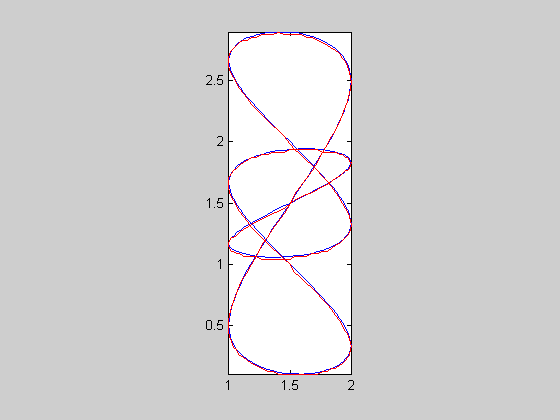 |
c57sc | 0.00145135 | 255 | 0.0466396 | -4.4223 | 1736 | 6.80784 | 27.1889 | 2.22666 | 2.05742 | 0.0215582 | 0.0197974 | 0.0224055 | 0.0216482 | |
| 8 | 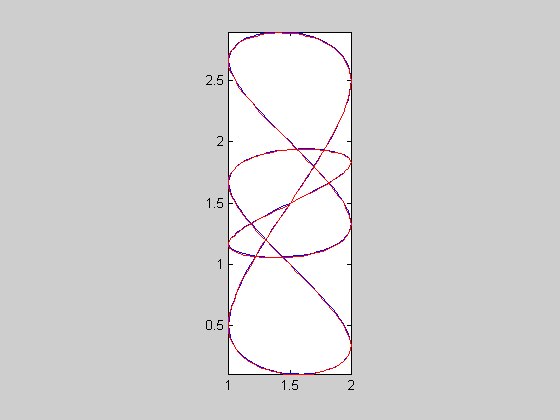 |
c58sc | 0.00145135 | 256 | 0.046108 | -4.43884 | 1760 | 6.875 | 25.9091 | 2.40525 | 1.85833 | 0.0106448 | 0.00957395 | 0.0107327 | 0.0103482 | |
| 9 | 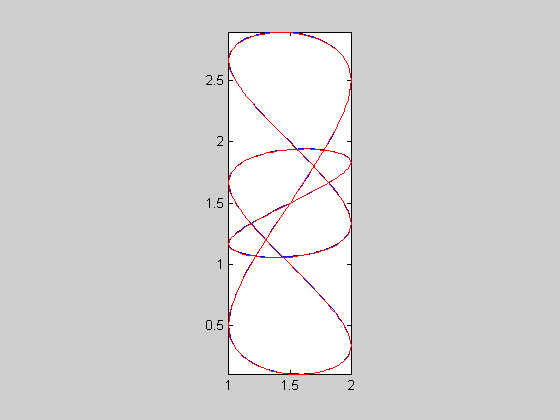 |
c59sc | 0.00145135 | 256 | 0.0460165 | -4.4417 | 1928 | 7.53125 | 23.2365 | 2.72464 | 1.76412 | 0.005605 | 0.00563043 | 0.005605 | 0.00556266 |
Mini-paper
Last updated by Nguyen and Howard at 2004-02-04 03:56:03 -0500